
StoryGraph
StoryGraph — start here
You’ve set up your world and your book settings. Now comes the part that makes Storyum different: you build the plot itself. The StoryGraph is where a story stops being a paragraph the model has to remember and becomes a structure the engine actually tracks — beats wired together, each carrying its own thread of tension, knowledge and change.
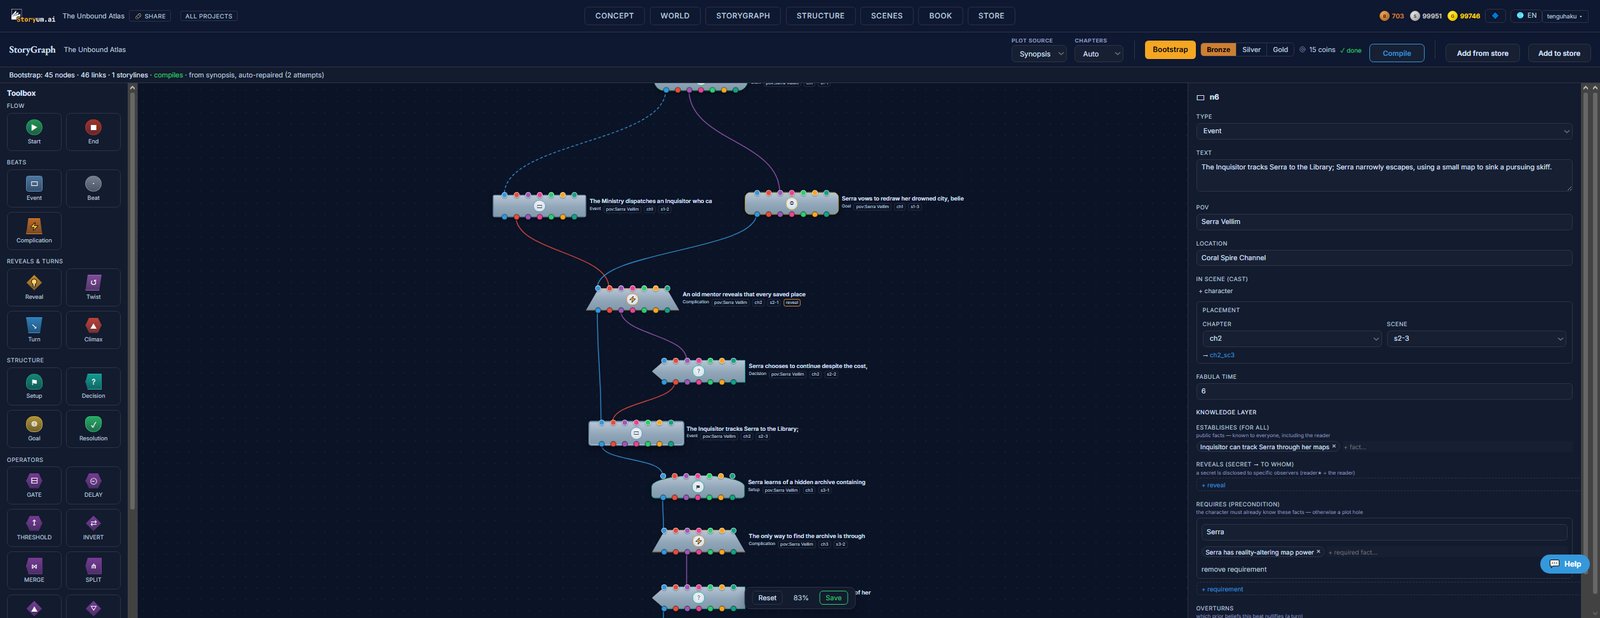
Where this fits. The StoryGraph is one of the ways to set your plot — the deepest one. You can also expand a seed into a synopsis, or let the graph be built from your synopsis and then refine it. Either way, the graph is the foundation the rest of the pipeline builds on: structure → bible → prose all derive from it.
Read these in order
New to the StoryGraph? Work through these top to bottom — each builds on the one before.
- 1What is a StoryGraph? →Start with the idea. A book is a house, and the plot is its foundation — why beautiful prose falls down without one, and how Storyum pours the foundation first.
- 2Inside the StoryGraph →How a plot is made computable: beats wired by typed connections, with a read-only interactive graph you can pan, zoom and explore.
- 3Channels — the typed connections →The seven colour-coded wires. A connection isn’t just “this, then that” — each carries one layer of the story (information, tension, character state…).
- 4The knowledge layer — who knows what →The layer that tracks what the reader knows versus each character — the machinery behind mystery, dramatic irony, and plot-hole-free reveals.
- 5Node types (13) →The beats you build with — Start, Event, Reveal, Twist, Turn, Climax, Setup, Decision, Goal, Resolution and more. One page each.
- 6Operators (13) →The transformers you drop on a wire — GATE, DELAY, THRESHOLD, INVERT, MERGE, PLANT/PAYOFF and more. The “math for writers”. One page each.
Once you’ve got the shape of it, open StoryGraph in the app and build — or hit Bootstrap to generate a first graph from your synopsis and refine from there.